I design user-centric SaaS platforms, mobile apps, and data visualizations, ensuring every product is both delightful to use and strategically measurable.

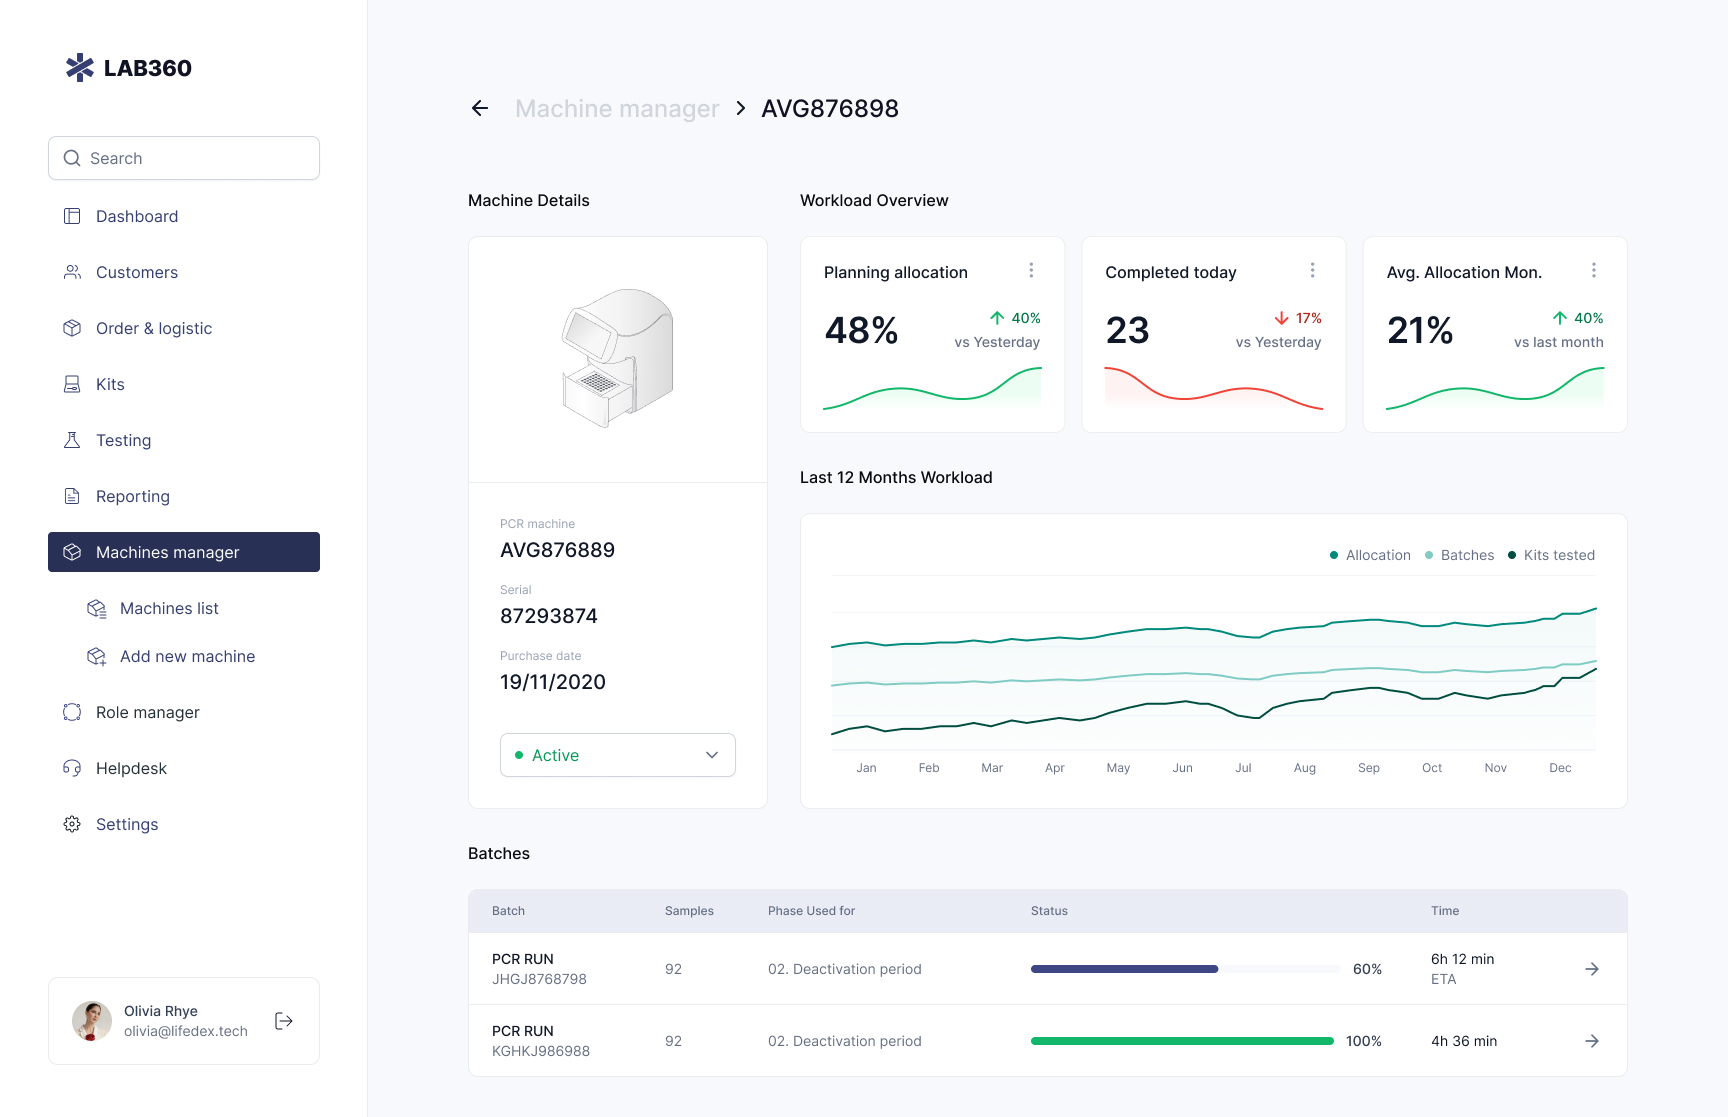
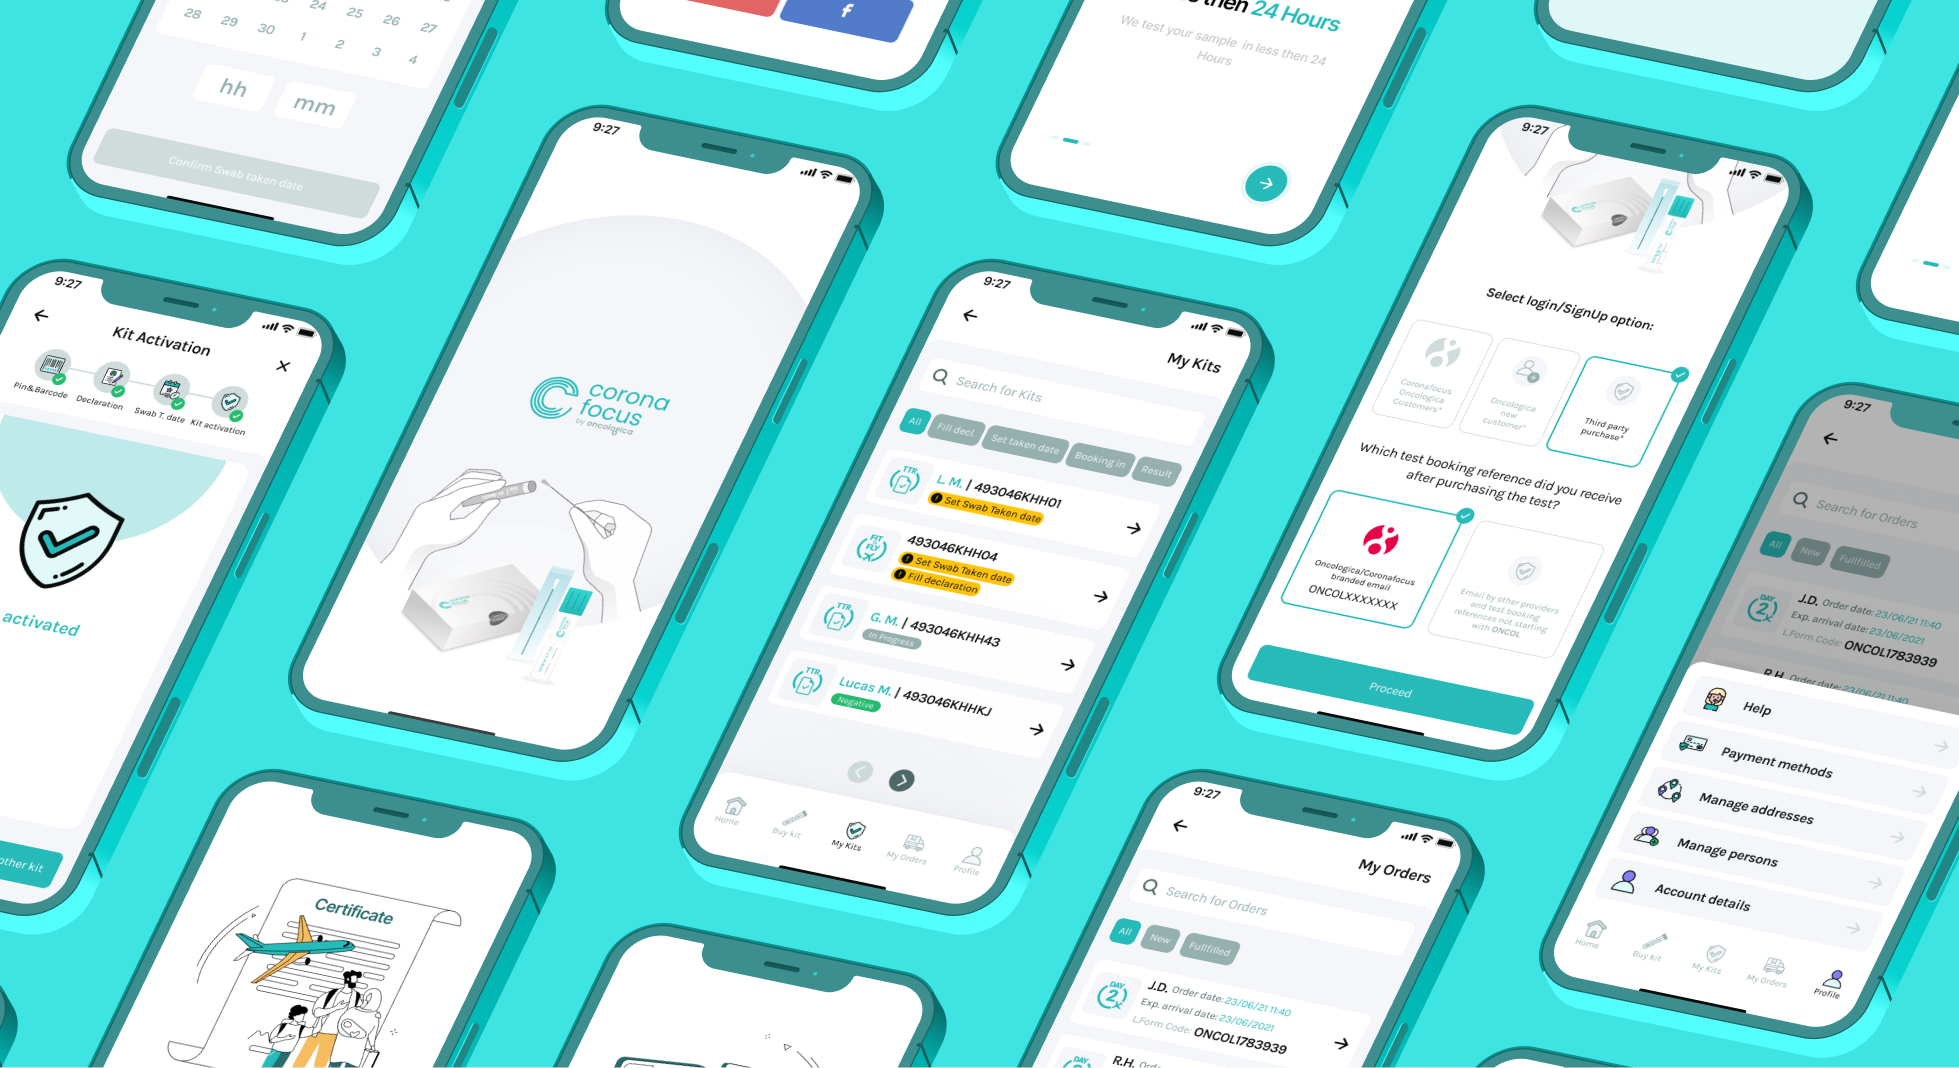
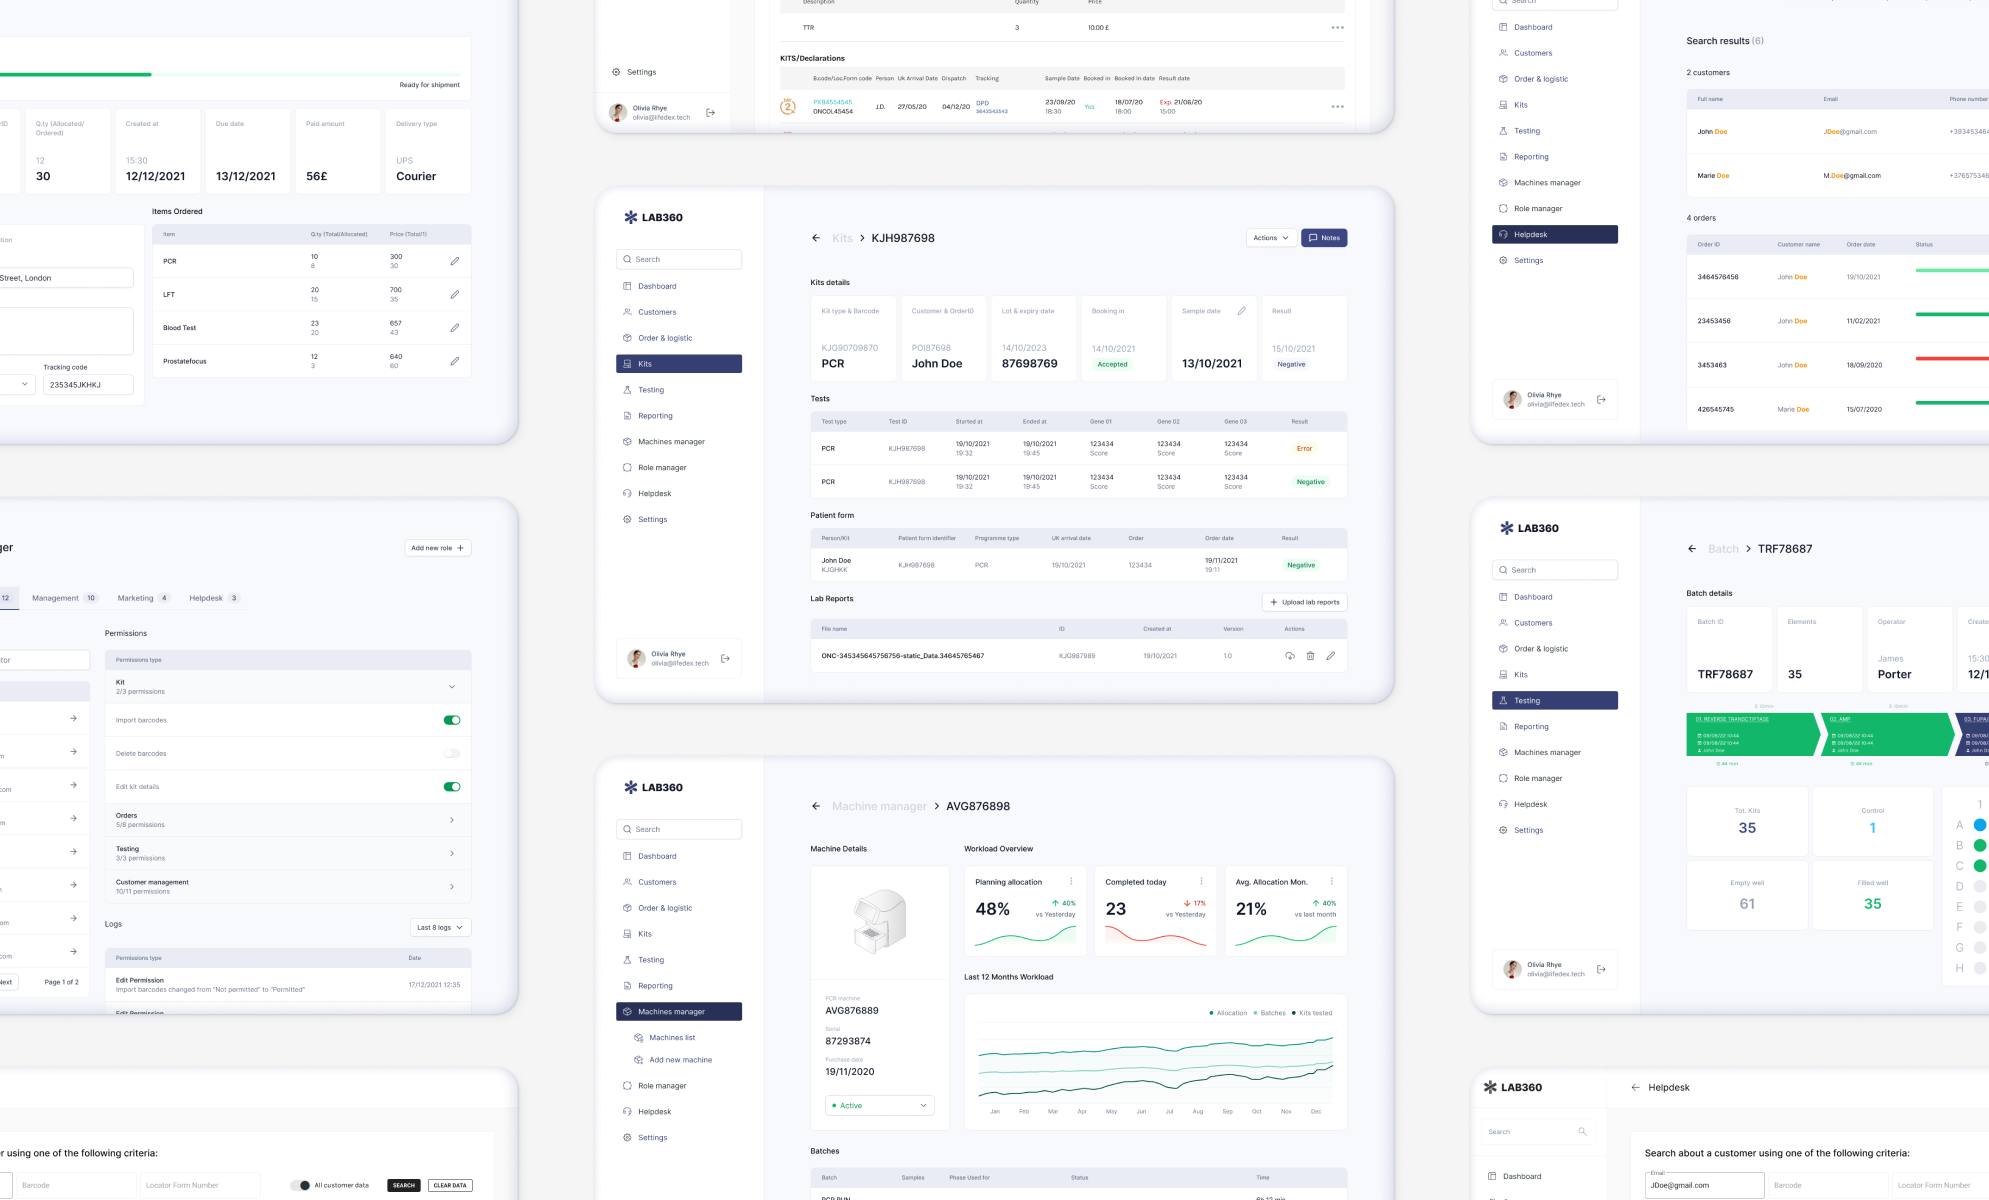
Designing intuitive user experiences for complex SaaS platforms and mobile apps, from initial research to pixel-perfect, scalable design systems.
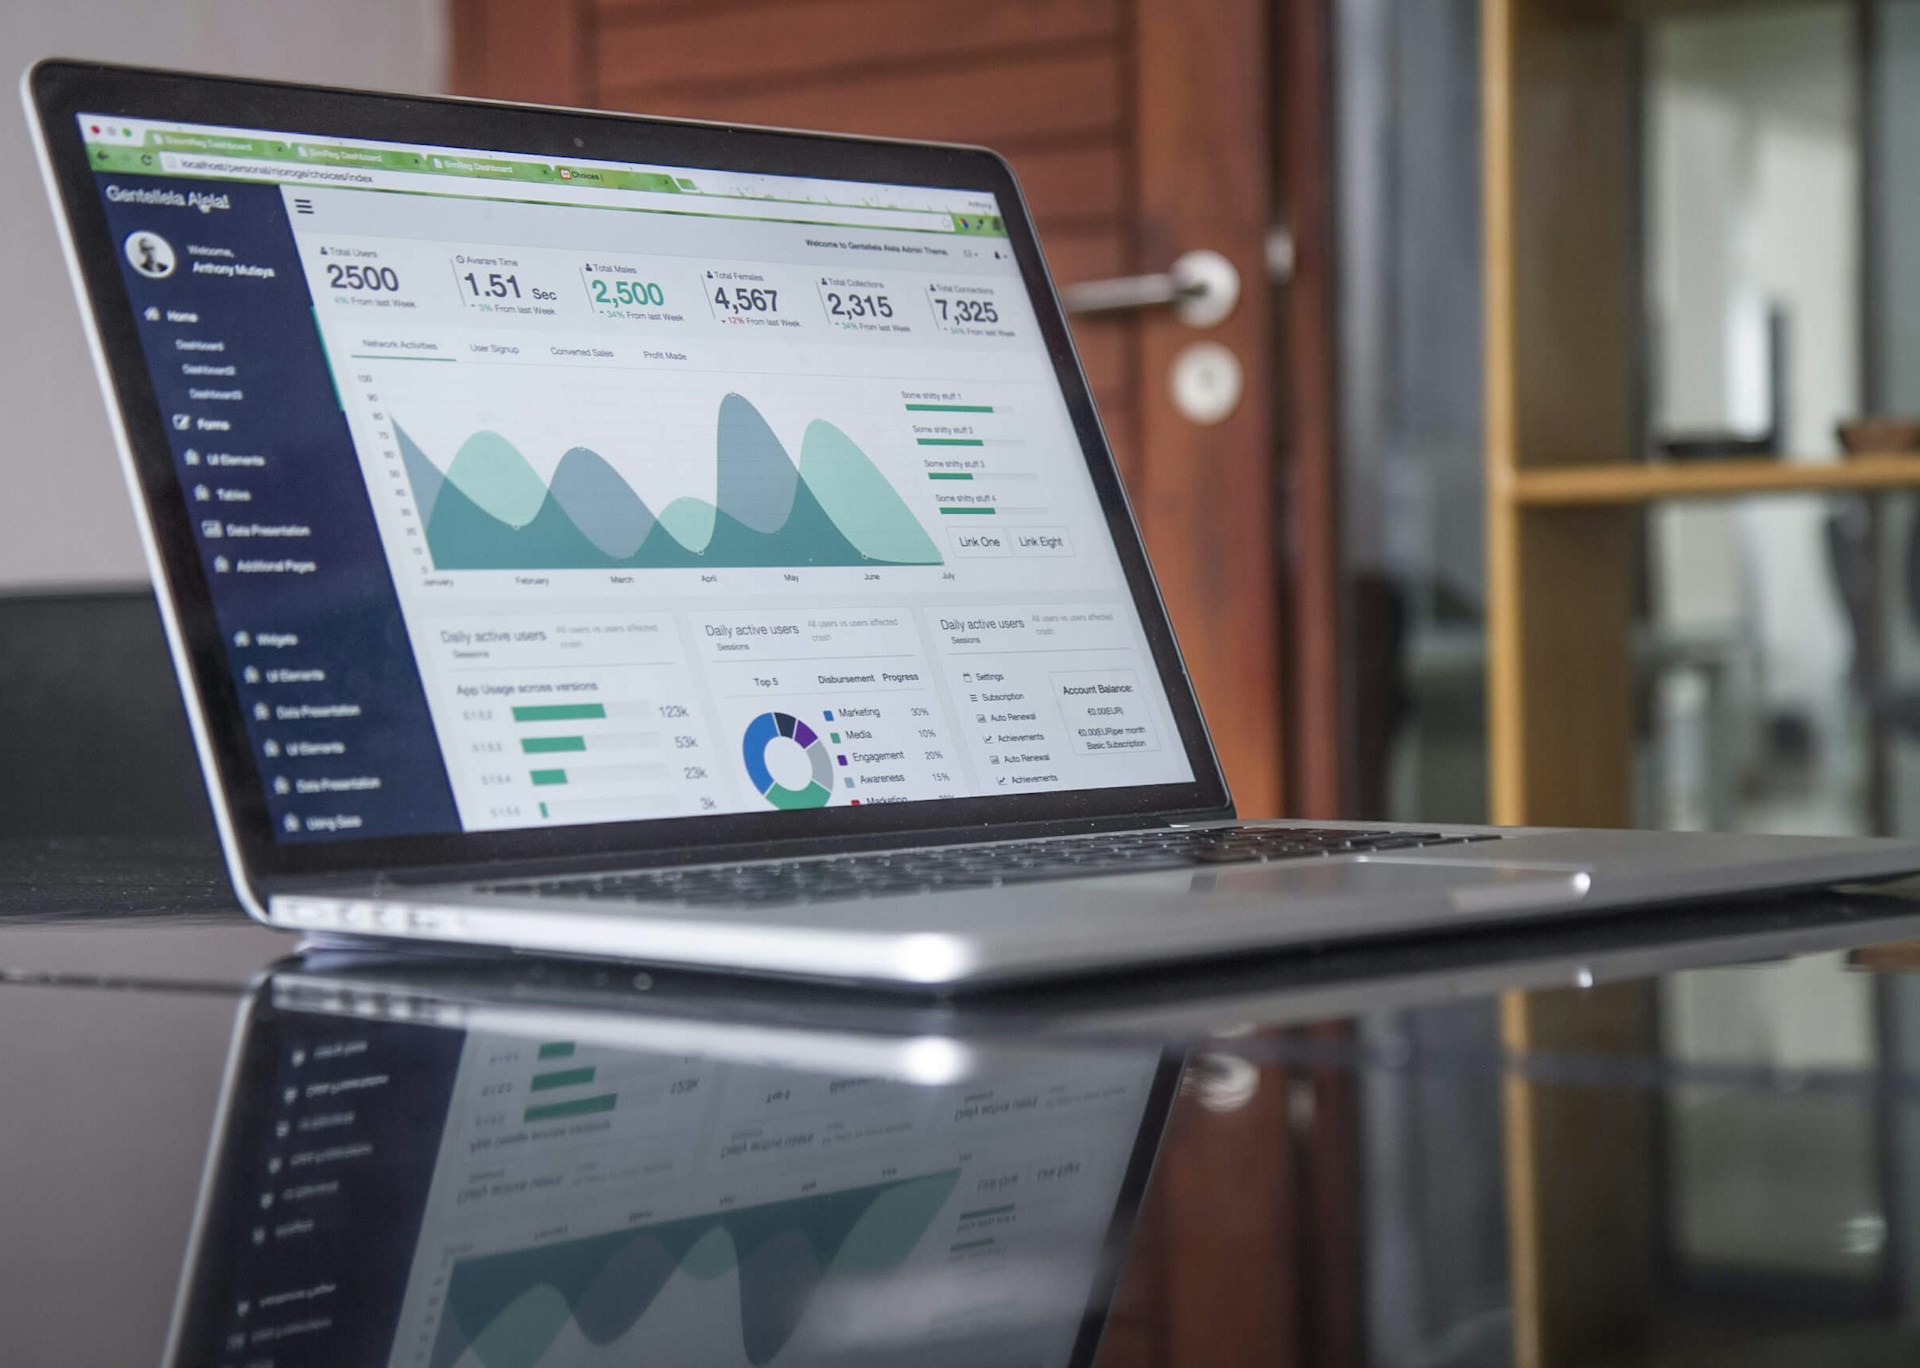
Building powerful Power BI dashboards with a unique UX-first approach, ensuring your data is not only accurate but also intuitive and actionable.

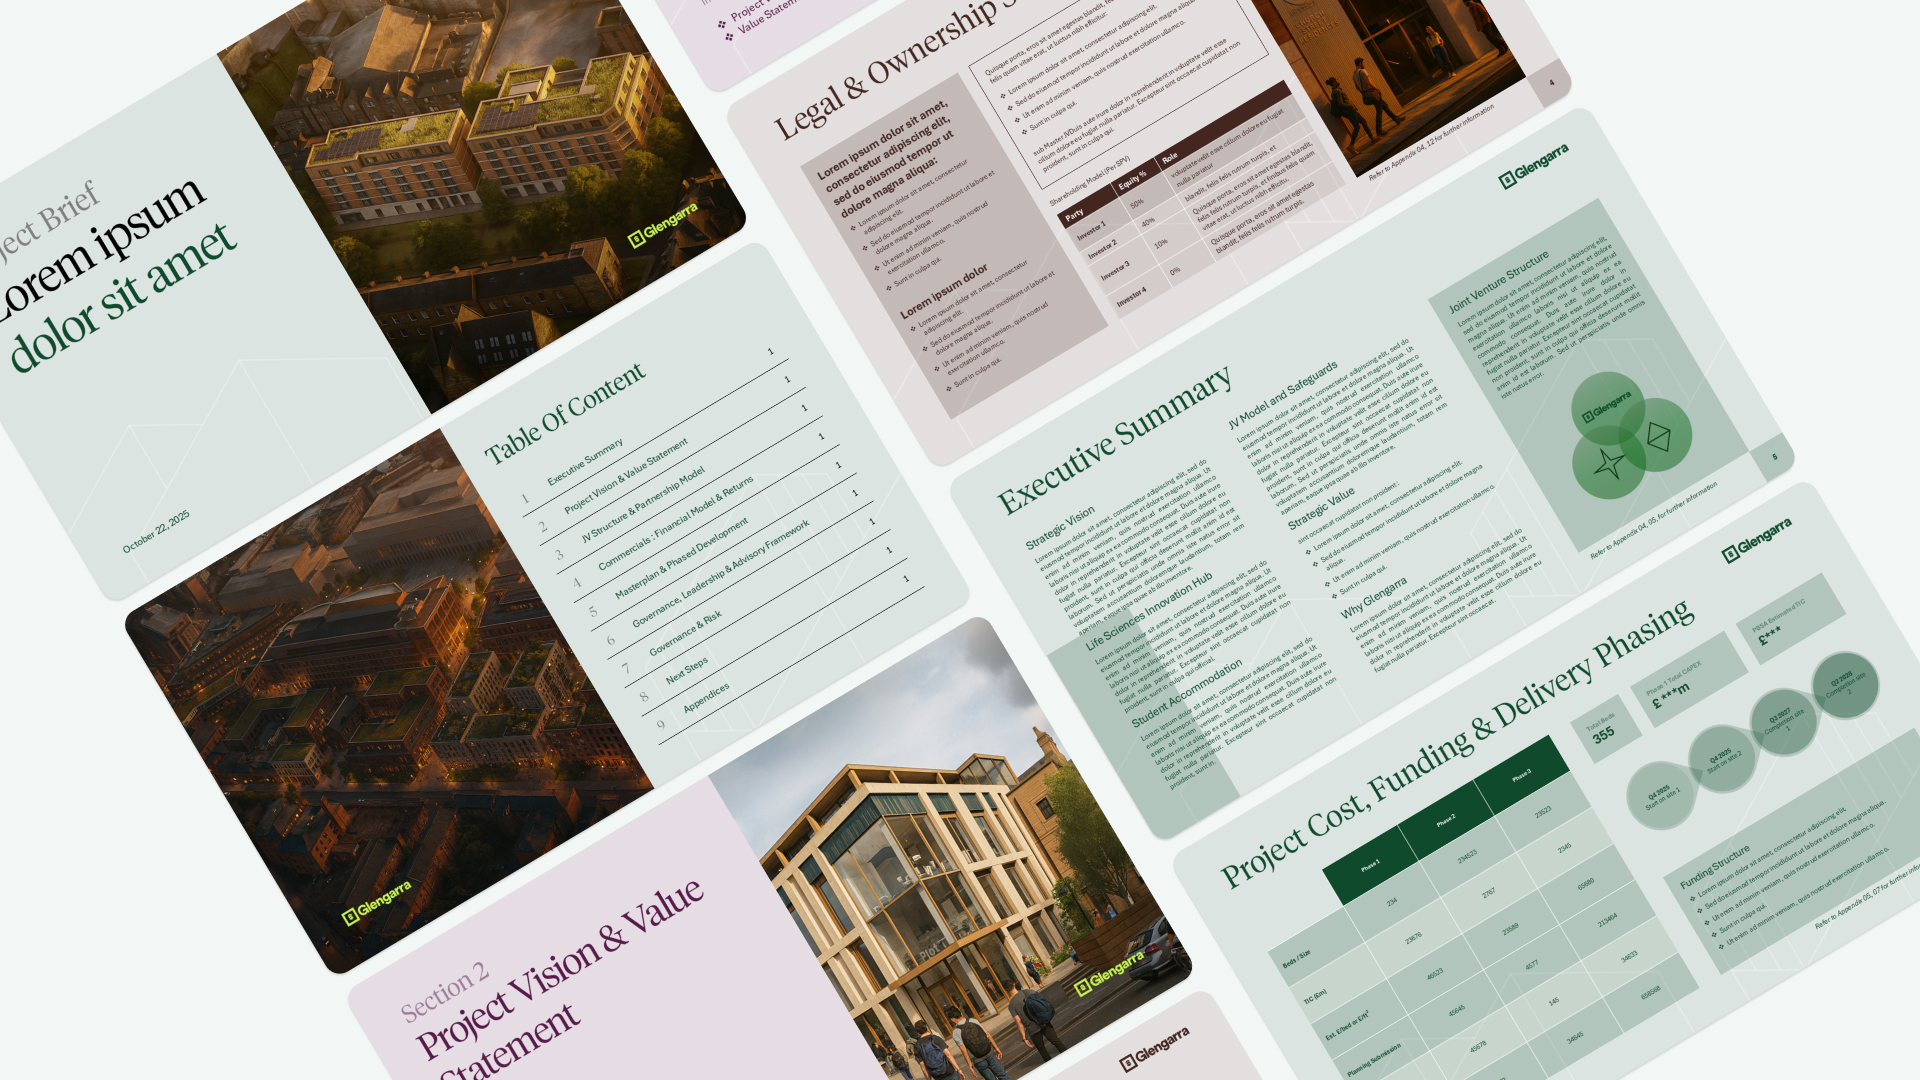
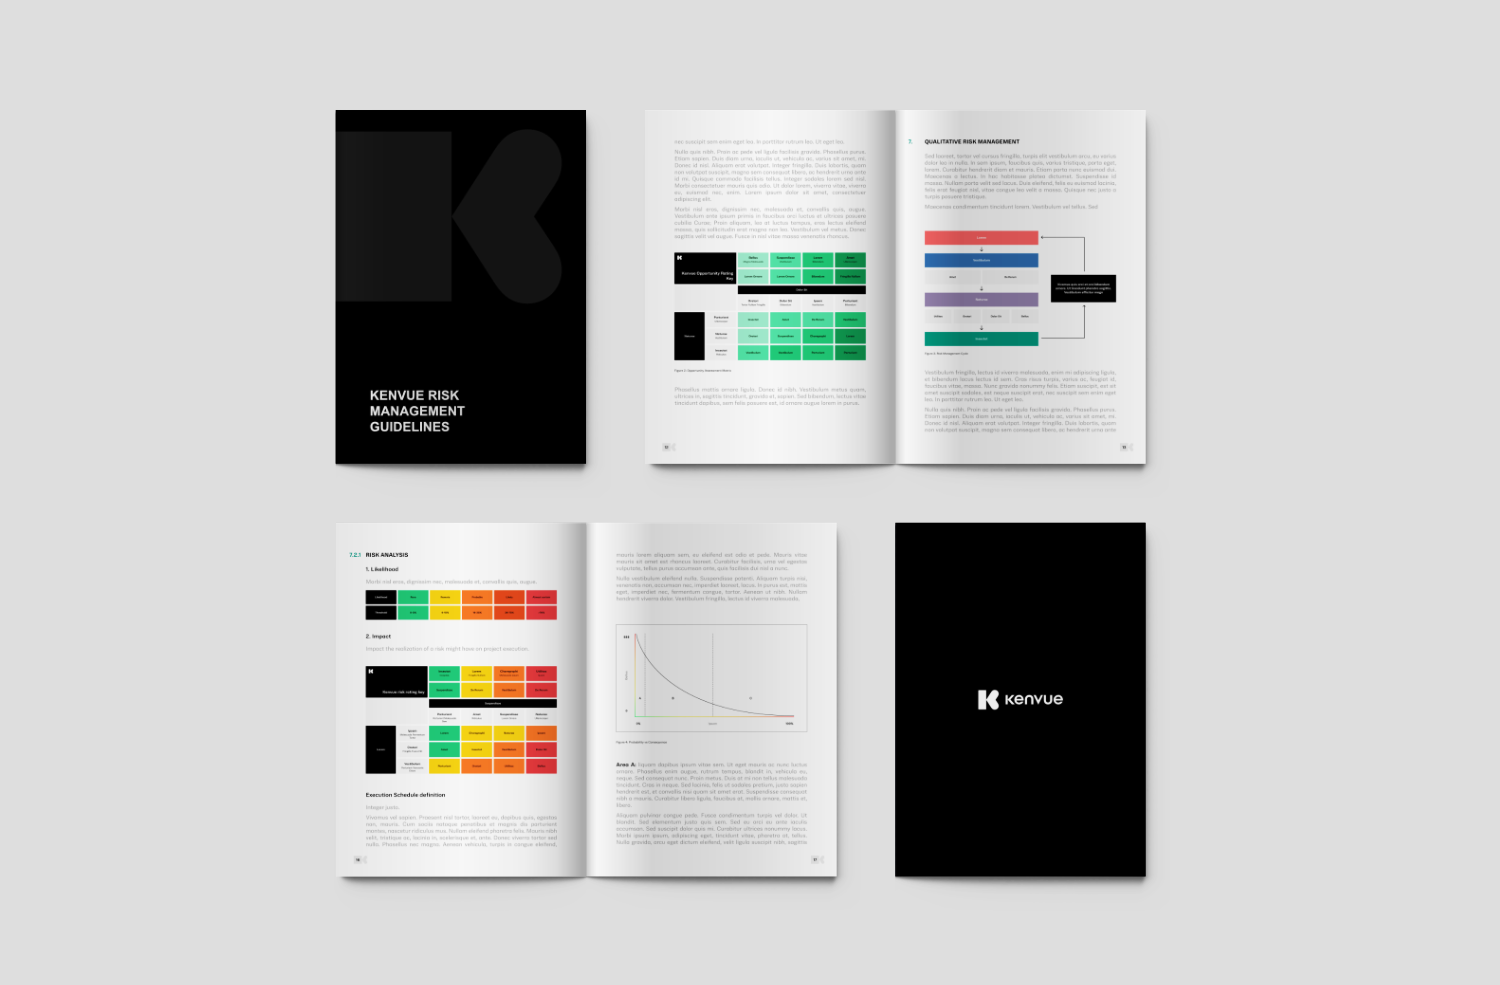
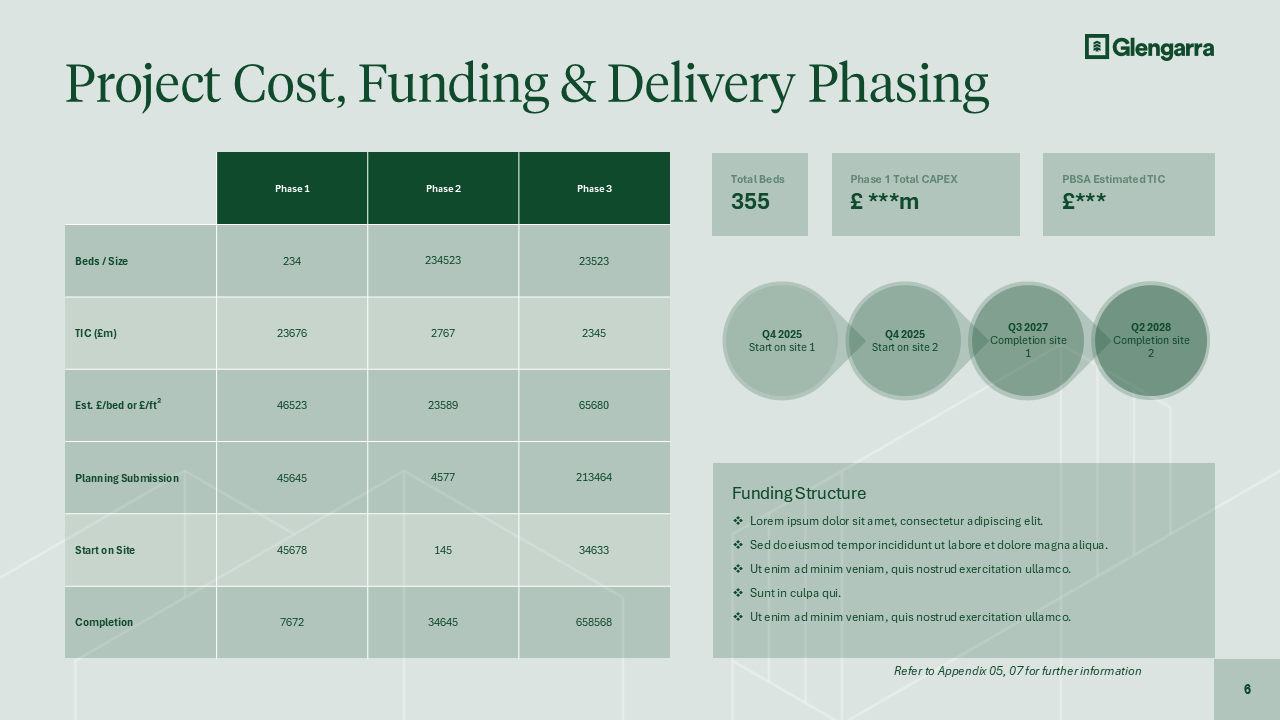
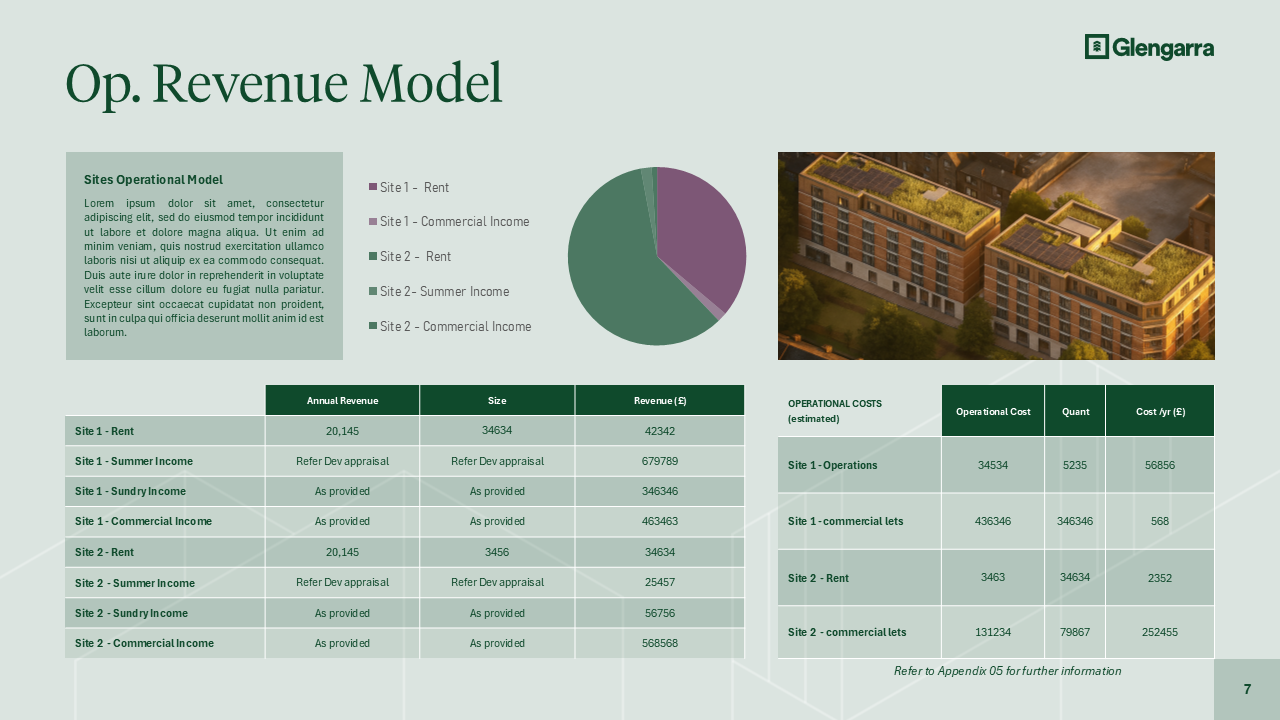
Turning complex data into compelling narratives. Designing high-impact PowerPoint decks and data stories that persuade stakeholders and drive strategic decisions.

I translate complex challenges into clear, effective digital solutions. Whether it's designing a user-friendly SaaS product, building a high-converting website, or crafting a persuasive pitch deck, my approach combines strategic thinking with meticulous UX/UI design. I focus on creating tools that are not just visually appealing, but truly understandable and usable, providing the confidence needed to achieve measurable growth.


Clear data leads to better decisions. My data visualization transforms numbers into immediate insights, giving you the speed and confidence needed to grow and win.
Increase in decision-making efficiency for teams that use data visualization tools.
The Power of Data Visualization: Insights, Tools, & Best Practices
Reduction in average meeting time for teams that utilize data visualization tools.
The Power of Data Visualization: Insights, Tools, & Best Practices
Return on investment over 3 years for companies using Power BI as a data visualization tool.
Total Economic Impact™" (TEI), condotto da Forrester Consulting
Have an idea or a challenge to solve? Tell me about it, and I'll personally get back to you.